Futures Playbook: VWAP + OR + Cross-Asset TellsFutures Playbook: VWAP + OR + Cross-Asset Tells (with Trade Messages + Coach Panel)
This all-in-one futures trading toolkit combines Opening Range (OR) levels, VWAP, and cross-asset signals to help traders quickly read intraday structure, manage execution, and filter noise.
Core Features
• Opening Range (OR):
• Customizable OR window with High/Low and Midpoint.
• Automatic shading of the OR zone.
• VWAP & Bands:
• Built-in or session-anchored VWAP.
• Optional standard deviation bands for context.
• Cross-Asset Tells:
• Live reads on US 10Y yield, DXY, Crude, and Gold.
• Regime detection: rates risk, USD strength, energy softness, and real-rate easing.
• Confirmations:
• Volume vs. moving average filter.
• Cumulative delta with smoothing.
• ATR-based chop filter to avoid low-quality trends.
Trade Messages + Coach Panel
• Trade Messages (labels): Automatic on-chart prompts for OR completion, VWAP reclaim/loss, long/short setups, and EU close flows.
• Coach Panel (table): Real-time dashboard with regime context, directional bias, execution notes, risk reminders, and key levels (ORH, ORL, VWAP).
Alerts
• OR breakout (long/short with confirmations).
• VWAP reclaim or loss.
• 10Y yield crossing risk threshold.
Use Case
Designed for futures traders and scalpers who rely on VWAP + OR dynamics and need cross-asset confirmation before committing to trades. Great for structuring entries, managing risk, and filtering market noise throughout the session.
스크립트에서 "key levels"에 대해 찾기

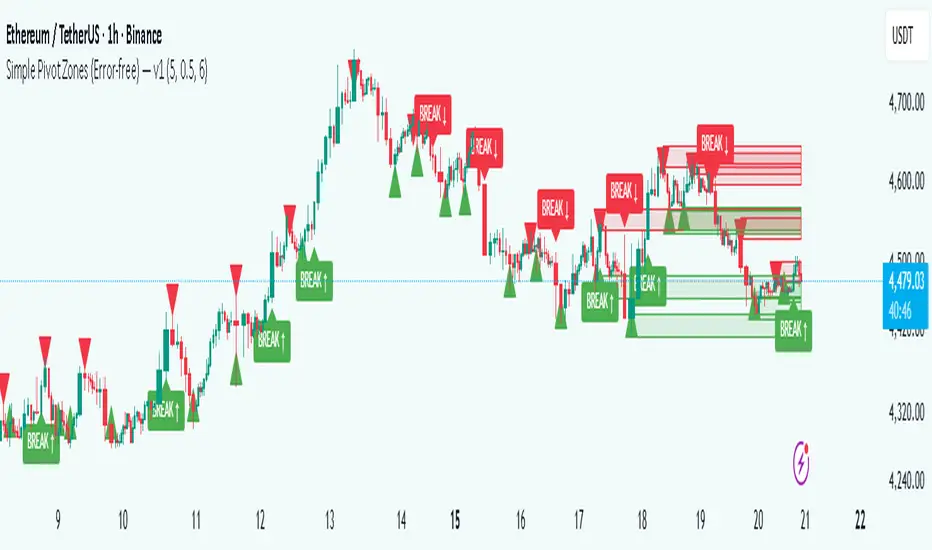
Simple Pivot Zones (Error-free) — v11. Core Idea
The indicator we built is a “pivot-based zone detector with breakout signals.”
It does three things:
1. Finds important swing highs and swing lows in price (pivots).
2. Creates support and resistance zones around those pivots using volatility (ATR).
3. Watches price action to see if those zones get broken, then gives signals.
________________________________________
2. What is a Pivot?
A pivot high happens when the price makes a local peak — a bar is higher than the bars around it.
A pivot low happens when the price makes a local dip — a bar is lower than the bars around it.
These are natural turning points in the market, showing where buyers or sellers had strong control temporarily. Traders often use them to draw support (pivot lows) and resistance (pivot highs).
________________________________________
3. Why Use ATR for Zones?
ATR (Average True Range) measures the average volatility of a market. Instead of drawing just a flat line at the pivot, we create a zone above and below it, sized according to ATR.
Example:
• If ATR is 20 points and zone size is 0.5, then the zone extends 10 points above and below the pivot level.
This turns thin “lines” into thicker areas of interest. Real markets don’t respect razor-thin levels, but zones are more realistic.
________________________________________
4. How Support & Resistance Zones Work
• Resistance zones are created at pivot highs. They mark where sellers were strong before.
• Support zones are created at pivot lows. They mark where buyers were strong before.
Over time, these zones extend forward until the price interacts with them.
________________________________________
5. Breakout Detection
The indicator checks whether the price closes beyond the last pivot high or low:
• If price closes above the last pivot high, it means buyers have broken resistance.
• If price closes below the last pivot low, it means sellers have broken support.
These moments are significant because they often trigger trend continuation.
________________________________________
6. Parameters It Uses
1. Pivot Length – how many bars to look back and forward to confirm a pivot. A higher length makes pivots less frequent but stronger.
2. ATR Length and Multiplier – defines the size of the zones (wider zones in more volatile markets).
3. Max Zones to Keep – avoids clutter by keeping only the most recent zones.
4. Colors & Styling – helps traders visually separate bullish and bearish zones.
________________________________________
7. How It Helps Traders
• Visual clarity: Instead of guessing support and resistance, the chart automatically highlights them.
• Dynamic adjustment: Zones adapt to volatility using ATR, making them useful in both calm and volatile markets.
• Breakout signals: Traders get notified when price actually breaks key levels, instead of reacting late.
• Cleaner charts: Instead of dozens of hand-drawn lines, the tool manages zones for you, deleting old ones.
________________________________________
8. The Logic in One Sentence
It finds important swing highs and lows, turns them into support/resistance zones scaled by volatility, and alerts you when the market breaks through them.
________________________________________
👉 In practice, this helps traders spot where the market is likely to bounce or break, and gives a framework to plan trades — for example, buying on bullish breakouts or selling on bearish breakouts.
________________________________________
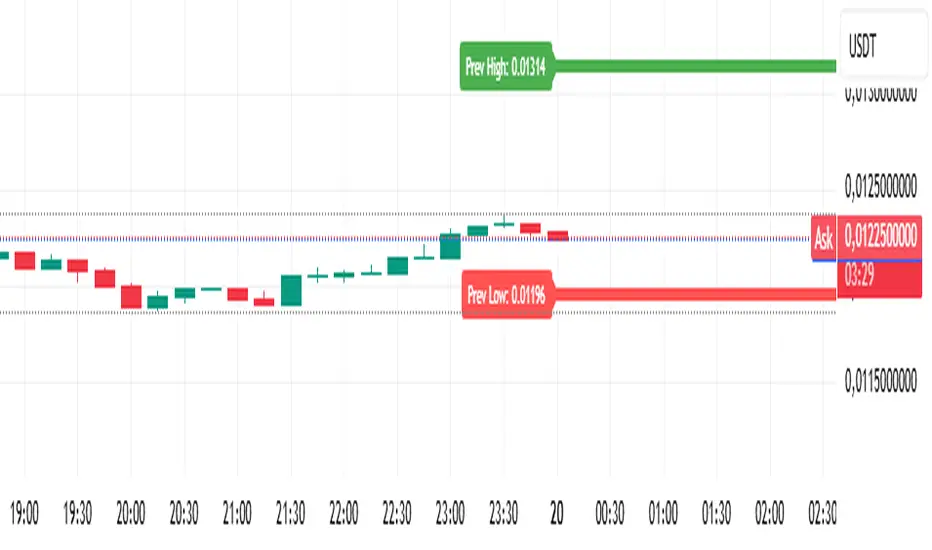
Analitica Trading — Previous Day SR (2 lines + labels) 2.0📊 Analitica Trading — Previous Day SR (Support & Resistance)
This indicator displays the previous day’s key levels on any timeframe:
Prev High → Green horizontal line with label.
Prev Low → Red horizontal line with label.
🔹 Stable across timeframes: The levels are calculated from the daily candles and remain fixed, no matter if you switch to 1D, 1H, or 5m.
🔹 Simple & clean: Exactly two lines only (no duplicates).
🔹 Price labels included: Each line has a clear tag showing the exact level.
🔹 Dynamic update: Lines refresh automatically at the start of each new daily session.
🔹 Alerts: Optional alerts trigger when the price breaks above the Prev High or below the Prev Low.
💡 Ideal for support/resistance trading, breakouts, and Smart Money Concepts (SMC) strategies.
FU + SMI Validator (Proper FU, 30m)Overview
The FU + SMI Validator is a sophisticated technical analysis indicator designed to detect Proper FU (Fakeouts or Liquidity Sweeps) on the 30-minute timeframe. This tool aims to help traders identify high-probability reversal setups that occur when price briefly breaks key levels (sweeping liquidity), then reverses with momentum confirmation.
Fakeouts are common market events where price action “hunts stops” before reversing direction. Correctly identifying these events can offer excellent entry points with defined risk. This indicator combines price action logic with momentum and volatility filters to provide reliable signals.
Core Concepts
Proper FU (Fakeout) Detection
At its core, the script identifies proper fakeouts by checking if the current bar’s price:
For bullish fakeouts: dips below the previous bar’s low (sweeping stops) and then closes above the previous bar’s high
For bearish fakeouts: spikes above the previous bar’s high and then closes below the previous bar’s low
This ensures that the breakout is a true sweep rather than just a one-sided close.
Optionally, the script can require one additional confirmation bar after the FU, ensuring that the momentum is sustained and reducing false signals.
SMI-style Momentum Validation
To improve the quality of signals, the indicator uses a proxy for the Stochastic Momentum Index (SMI) by calculating the difference between current and past linear regression slopes of price. This momentum check helps ensure that fakeouts occur alongside actual directional strength.
Key points:
Momentum must be increasing in the direction of the FU signal.
Momentum filters can be enabled or disabled based on user preference.
Squeeze Condition to Avoid Low-Volatility Traps
The script includes a volatility filter based on a squeeze-like condition:
It compares Bollinger Bands (BB) and Keltner Channels (KC).
When BB bands contract inside KC bands, the market is in a squeeze state, signaling low volatility.
Fakeouts during squeeze conditions are often unreliable; the script can filter these out to reduce false alarms.
Killzone Session Timing Filter
Recognizing that liquidity and volatility vary by session, this tool supports optional filtering for:
London Killzone: 09:00 to 10:30 (UK time)
New York Killzone: 13:00 to 14:30 (UK time)
Signals only trigger during these high-activity windows if enabled, helping traders focus on periods with the best liquidity and market participation.
Note: For Killzone filtering to work accurately, your TradingView chart must be set to the UK timezone.
Features & Benefits
Robust FU detection ensures the breakout price action is meaningful, reducing noise.
Momentum filter via linear regression slope captures trend strength in a smooth, mathematically sound way.
Low-volatility squeeze avoidance helps reduce false signals in choppy or range-bound markets.
Killzone timing filter focuses your attention on the most liquid and active market hours.
Optional confirmation bar increases signal reliability.
Raw FU markers allow visualization of all detected fakeouts for pattern recognition and manual analysis.
Alerts built-in for both valid buy and sell FU setups, enabling real-time notification and quicker decision-making.
Customization Options
Killzone usage: Enable or disable the session timing filter.
Sessions: Configure London and New York killzone time ranges.
Momentum alignment: Enable or disable momentum filter based on SMI proxy.
Volatility filter: Avoid signals during squeeze or low-volatility conditions.
FU confirmation: Option to require one additional confirming candle after the initial FU.
Squeeze and momentum parameters: Adjust Bollinger Bands length and multiplier, Keltner Channel length and ATR multiplier.
Raw FU markers: Show or hide all detected fakeouts regardless of filters.
How to Use This Indicator
Apply to 30-minute charts for forex pairs, indices, cryptocurrencies, or other instruments.
Set your chart timezone to UK time if using Killzone filters.
Adjust input parameters based on your preferred sessions and risk tolerance.
Look for green “VALID BUY FU” labels below bars for bullish fakeout entries.
Look for red “VALID SELL FU” labels above bars for bearish fakeout entries.
Use the alert system to receive notifications on setups.
Combine with your existing analysis or risk management strategy for entries, stops, and profit targets.
Why Use FU + SMI Validator?
Fakeouts are some of the most lucrative but tricky setups for many traders. Without proper filters, they can lead to false entries and losses. This script integrates price action, momentum, volatility, and session timing into one package, providing a robust tool to spot high-quality fakeout opportunities and improve trading confidence.
Limitations
Requires chart to be set to UK timezone for session filters.
Designed specifically for 30-minute timeframe — performance on other timeframes may vary.
Momentum is a proxy, not a direct SMI calculation.
Like all indicators, best used in conjunction with sound risk management and other analysis tools.
Potential Enhancements
Conversion into a full strategy script for backtesting entries and exits.
Addition of other momentum indicators (RSI, MACD) or volume filters.
Customizable time zones or auto time zone detection.
Multi-timeframe analysis capabilities.
Visual dashboard for summary of signal stats.

Bar Statistics - DELTA/OI/TOTAL/BUY/SELL/LONGS/SHORTSBar Statistics - Advanced Volume & Open Interest Analysis
Overview
The Bar Statistics indicator is a comprehensive analytical tool designed to provide traders with detailed insights into market microstructure through advanced volume analysis, open interest tracking, and market flow detection. This indicator transforms complex market data into easily digestible visual information, displaying six key metrics in customizable colored boxes that update in real-time.
Unlike traditional volume indicators that only show basic volume data, this indicator combines multiple data sources to reveal the underlying forces driving price movement, including volume delta calculations from lower timeframes, open interest changes, and estimated market positioning.
What Makes This Indicator Unique
1. Multi-Timeframe Volume Delta Precision
The indicator utilizes lower timeframe data (default 1-second) to calculate highly accurate volume delta measurements, providing much more precise buy/sell pressure analysis than standard timeframe-based calculations. This approach captures intraday volume dynamics that are often missed by conventional indicators.
2. Real-Time Updates
Unlike many indicators that only update on bar completion, this tool provides live updates for the developing candle, allowing traders to see evolving market conditions as they happen.
3. Market Flow Analysis
The unique "L/S" (Long/Short) metric combines open interest changes with price/volume direction to estimate net market positioning, helping identify when participants are accumulating or distributing positions.
4. Adaptive Visual Intensity
The gradient color system automatically adjusts based on historical context, making it easy to identify when current values are significant relative to recent market activity.
5. Complete Customization
Every aspect of the display can be customized, from the order of metrics to individual color schemes, allowing traders to adapt the tool to their specific analysis needs.
6.All In One Solution
6 Metrics in one indicator no more using 5 different indicators.
Core Features Explained
DELTA (Volume Delta)
What it shows: Net difference between aggressive buy volume and aggressive sell volume
Calculation: Uses lower timeframe data to determine whether each trade was initiated by buyers or sellers
Interpretation:
Positive values indicate aggressive buying pressure
Negative values indicate aggressive selling pressure
Magnitude indicates the strength of directional pressure
OI Δ (Open Interest Change)
What it shows: Change in open interest from the previous bar
Data source: Fetches open interest data using the "_OI" symbol suffix
Interpretation:
Positive values indicate new positions entering the market
Negative values indicate positions being closed
Combined with price direction, reveals market participant behavior
L/S (Net Long/Short Bias)
What it shows: Estimated net change in long vs short market positions
Calculation method: Combines open interest changes with price/volume direction using configurable logic
Scenarios analyzed:
New Longs: Rising OI + Rising Price/Volume = Long position accumulation
Liquidated Longs: Falling OI + Falling Price/Volume = Long position exits
New Shorts: Rising OI + Falling Price/Volume = Short position accumulation
Covered Shorts: Falling OI + Rising Price/Volume = Short position exits
Result: Net bias toward long (positive) or short (negative) market sentiment
TOTAL (Total Volume)
What it shows: Standard volume for the current bar
Purpose: Provides context for other metrics and baseline activity measurement
Enhanced display: Uses gradient intensity based on recent volume history
BUY (Estimated Buy Volume)
What it shows: Estimated aggressive buy volume
Calculation: (Total Volume + Delta) / 2
Use case: Helps quantify the actual buying pressure in monetary/contract terms
SELL (Estimated Sell Volume)
What it shows: Estimated aggressive sell volume
Calculation: (Total Volume - Delta) / 2
Use case: Helps quantify the actual selling pressure in monetary/contract terms
Configuration Options
Timeframe Settings
Custom Timeframe Toggle: Enable/disable custom lower timeframe selection
Timeframe Selection: Choose the precision level for volume delta calculations
Auto-Selection Logic: Automatically selects optimal timeframe based on chart timeframe
Net Positions Calculation
Direction Method: Choose between Price-based or Volume Delta-based direction determination
Value Method: Select between Open Interest Change or Volume for position size calculations
Display Customization
Row Order: Completely customize which metrics appear and in what order (6 positions available)
Color Schemes: Individual color selection for positive/negative values of each metric
Gradient Intensity: Configurable lookback period (10-200 bars) for relative intensity calculations
Visual Elements
Box Format: Clean, professional box display with clear labels
Color Coding: Intuitive color schemes with customizable transparency gradients
Real-time Updates: Live updating for developing candles with historical stability
How to Use This Indicator
For Day Traders
Volume Confirmation: Use DELTA to confirm breakout validity - strong directional moves should show corresponding volume delta
Entry Timing: Watch for volume delta divergences at key levels to time entries
Exit Signals: Monitor when aggressive volume shifts against your position
For Swing Traders
Market Flow: Focus on the L/S metric to identify when participants are accumulating or distributing
Open Interest Analysis: Use OI Δ to confirm whether moves are backed by new money or position adjustments
Trend Validation: Combine multiple metrics to validate trend strength and sustainability
For Scalpers
Real-time Edge: Utilize the live updates to see developing imbalances before bar completion
Quick Decision Making: Focus on DELTA and BUY/SELL for immediate market pressure assessment
Volume Profile: Use TOTAL volume context for optimal entry/exit sizing
Setup Recommendations
Futures Markets: Enable OI tracking and use Volume Delta direction method
Crypto Markets: Focus on DELTA and volume metrics; OI may not be available
Stock Markets: Use Price direction method with volume value calculations
High-Frequency Analysis: Set lower timeframe to 1S for maximum precision
Technical Implementation
Data Accuracy
Utilizes TradingView's ta.requestVolumeDelta() function for precise buy/sell classification
Implements error checking for data availability
Handles missing data gracefully with fallback calculations
Performance Optimization
Efficient array management with configurable lookback periods
Smart box creation and deletion to prevent memory issues
Optimized real-time updates without historical data corruption
Compatibility
Works on all timeframes from seconds to daily
Compatible with futures, forex, crypto, and stock markets
Automatically adjusts calculation methods based on available data
Risk Disclaimers
This indicator is designed for educational and analytical purposes. It provides statistical analysis of market data but does not guarantee trading success. Users should:
Combine with other forms of analysis
Practice proper risk management
Understand that past performance doesn't predict future results
Be aware that volume delta and open interest data quality varies by market and data provider
Conclusion
The Bar Statistics indicator represents a significant advancement in retail trader access to professional-grade market analysis tools. By combining multiple data sources into a single, customizable display, it provides the depth of analysis needed for comprehensive market microstructure understanding while maintaining the simplicity required for effective decision-making.

CCI Stochastic - YOSI
CCI Stochastic (Pro v6) – MTF, Adaptive Bands & Live Label
What it does
This indicator applies a Stochastic calculation on the CCI (K/D lines) to highlight momentum shifts, overbought/oversold zones, and adaptive market regimes. It comes with optional higher-timeframe confirmation, adaptive volatility bands, a live value label, and built-in alerts.
Key Features
Core Signal: Choose between D or K line of the Stoch-CCI.
Extreme Zones: Customizable OB/OS thresholds (default 80/20) and a midline (50), with dynamic background shading.
Adaptive Bands (optional): Mean ± k·standard deviation of the signal, to capture cyclic extremes.
MTF Confirmation (optional): Fetches the same signal from a higher timeframe via request.security.
Arrows/Signals:
Enter – Cross above OS (Buy) / below OB (Sell).
Center – Cross of the 50 midline (momentum shift).
Exit – Exit from extreme zones.
Alerts: All arrow signals + adaptive band crosses.
Live Value Label: Shows the latest signal value near the last bar, customizable decimals/offset/background colors.
Visuals: Red line above OB, green below OS, gray neutral; adaptive band fills.
Use Cases
Momentum / Reversals: Enter with OS/OB crosses confirmed by MTF.
Trend validation: Combine with moving averages (e.g., EMA200) or support/resistance.
Mean Reversion: Fade extreme zones, especially with adaptive band or OB/OS exit alerts.
Inputs
CCI Period, Stoch Period, Smooth K/D – core calculation.
Overbought / Oversold – thresholds (default 80/20).
Line to plot – K or D.
Show Arrows (Enter, Center, Exit) – visual control.
Adaptive Bands – length and k multiplier.
Higher TF – optional confirmation timeframe.
Live Label – decimals, offset, colors.
Quick Tips
For scalping/short-term setups: tighten OB/OS (e.g., 85/15) to filter noise.
In high volatility: increase adaptLen or decrease k to smooth bands.
Reduce false signals: require local + MTF alignment (e.g., only long if MTF > 50).
Disclaimer
This is a technical analysis tool – not a standalone buy/sell signal. Always use with proper risk management, key levels, and confluence from multiple factors.
מה זה עושה?
האינדיקטור מחשב Stochastic על CCI (קו K/D) ומציג אזורי קיצון, חציות ומשטרי שוק. הוא כולל אופציה לאישור מטיימפריים גבוה, בנדים אדפטיביים, תווית ערך חיה והתרעות מוכנות.
יכולות עיקריות
סיגנל מרכזי: בחירה בין קו D או K של Stoch-CCI.
אזורי קיצון: קווים ניתנים להגדרה (ברירת מחדל 80/20) וקו אמצע 50, עם צביעת רקע דינמית כשנכנסים לקיצון.
Adaptive Bands (אופציונלי): ממוצע ± k·סטיית תקן של הסיגנל—מסייע לזהות overheat ומחזוריות.
אישור MTF (אופציונלי): אותו סיגנל מטיימפריים גבוה באמצעות request.security.
חיצים/סיגנלים:
Enter – חציה מלמטה מעל OS (קנייה) / מלמעלה מתחת OB (מכירה).
Center – חציה של 50 (שינוי מומנטום).
Exit – יציאה מאזורים קיצוניים (OS/OB).
Alerts: לכל הסיגנלים לעיל + כניסה/יציאה לבנדים האדפטיביים.
תווית ערך חיה: מציגה את ערך הסיגנל האחרון ליד הנקודה (ספרות ו־offset ניתנים להגדרה).
עיצוב קריא: צבע קו אדום מעל OB, ירוק מתחת OS, אפור ניטרלי; מילוי אזורים.
שימוש מומלץ
מומנטום/היפוכים: כניסה עם חציה מה-OS/OB ואישור מה-MTF.
ממוצע נע/רמות מחיר: חברו לאימות מגמה (למשל EMA200 או תמיכה/התנגדות).
Mean Reversion: חיפוש חזרה מאזורי קיצון, במיוחד כשיש התרעת יציאה מ-OB/OS או נגיעה בבנד אדפטיבי.
קלטים מרכזיים
CCI Period, Stoch Period, Smooth K/D – פרמטרי חישוב.
Overbought / Oversold – ספי קיצון (ברירת מחדל 80/20).
Line to plot – בחירה בין K או D.
Show Arrows/Center/Exit/Enter – שליטה בתצוגת החיצים.
Adaptive Bands (len, k) – חלון ורגישות לבנדים.
Higher TF – טיימפריים לאישור (אופציונלי).
Live Label – ספרות, היסט ברים, צבעי רקע.
טיפים מהירים
בסקלפים/טווחים קצרים: הקשיחו ספי קיצון (למשל 85/15) להפחתת רעש.
בשוק תנודתי: העלו את adaptLen או הורידו את k כדי לקבל בנדים רגישים פחות.
להקטנת אותות שווא: דרשו התאמה בין הסיגנל המקומי ל-MTF (לדוגמה, לונג רק כשה-MTF מעל 50).
הערה חשובה
זהו כלי ניתוח טכני—לא אות קנייה/מכירה בפני עצמו. שלבו אותו עם ניהול סיכונים (SL/TP), בדיקת רמות מפתח ואימות ממספר אינדיקטורים או טיימפריימים.

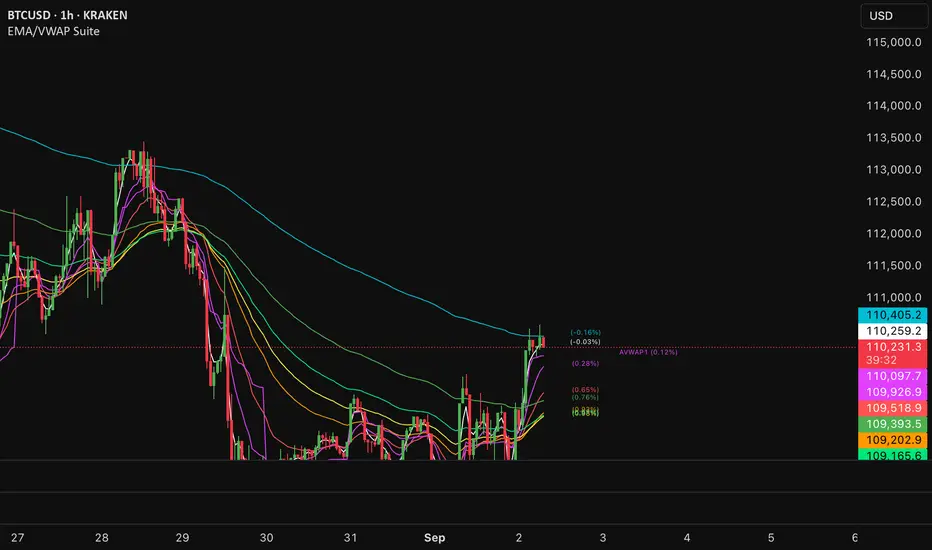
EMA/VWAP SuiteEMA/VWAP Suite
Overview
The EMA/VWAP Suite is a versatile and customizable Pine Script indicator designed for traders who want to combine Exponential Moving Averages (EMAs) and Volume Weighted Average Prices (VWAPs) in a single, powerful tool. It overlays up to eight EMAs and six VWAPs (three anchored, three rolling) on the chart, each with percentage difference labels to show how far the current price is from these key levels. This indicator is perfect for technical analysis, supporting strategies like trend following, mean reversion, and VWAP-based trading.
By default, the indicator displays eight EMAs and a session-anchored VWAP (AVWAP 1, in fuchsia) with their respective percentage difference labels, keeping the chart clean yet informative. Other VWAPs and their bands are disabled by default but can be enabled and customized as needed. The suite is designed to minimize clutter while providing maximum flexibility for traders.
Features
- Eight Customizable EMAs: Plot up to eight EMAs with user-defined lengths (default: 3, 9, 19, 38, 50, 65, 100, 200), each with a unique color for easy identification.
- EMA Percentage Difference Labels: Show the percentage difference between the current price and each EMA, displayed only for visible EMAs when enabled.
- Three Anchored VWAPs: Plot VWAPs anchored to the start of a session, week, or month, with customizable source, offset, and band multipliers. AVWAP 1 (session-anchored, fuchsia) is enabled by default.
- Three Rolling VWAPs: Plot VWAPs calculated over fixed periods (default: 20, 50, 100), with customizable source, offset, and band multipliers.
- VWAP Bands: Optional upper and lower bands for each VWAP, based on standard deviation with user-defined multipliers.
- VWAP Percentage Difference Labels: Display the percentage difference between the current price and each VWAP, shown only for visible VWAPs. Enabled by default to show the AVWAP 1 label.
- Customizable Colors: Each VWAP has a user-defined color via input settings, with labels matching the VWAP line colors (e.g., AVWAP 1 defaults to fuchsia).
Flexible Display Options: Toggle individual EMAs, VWAPs, bands, and labels on or off to reduce chart clutter.
Settings
The indicator is organized into intuitive setting groups:
EMA Settings
Show EMA 1–8 : Toggle each EMA on or off (default: all enabled).
EMA 1–8 Length : Set the period for each EMA (default: 3, 9, 19, 38, 50, 65, 100, 200).
Show EMA % Difference Labels : Enable/disable percentage difference labels for all EMAs (default: enabled).
EMA Label Font Size (8–20) : Adjust the font size for EMA labels (default: 10, mapped to “tiny”).
Anchored VWAP 1–3 Settings
Show AVWAP 1–3 : Toggle each anchored VWAP on or off (default: AVWAP 1 enabled, others disabled).
AVWAP 1–3 Color : Set the color for each VWAP line and its label (default: fuchsia for AVWAP 1, purple for AVWAP 2, teal for AVWAP 3).
AVWAP 1–3 Anchor : Choose the anchor period (“Session,” “Week,” “Month”; default: Session for AVWAP 1, Week for AVWAP 2, Month for AVWAP 3).
AVWAP 1–3 Source : Select the price source (default: hlc3).
AVWAP 1–3 Offset : Set the horizontal offset for the VWAP line (default: 0).
Show AVWAP 1–3 Bands : Toggle upper/lower bands (default: disabled).
AVWAP 1–3 Band Multiplier : Adjust the standard deviation multiplier for bands (default: 1.0).
Rolling VWAP 1–3 Settings
Show RVWAP 1–3 : Toggle each rolling VWAP on or off (default: disabled).
RVWAP 1–3 Color : Set the color for each VWAP line and its label (default: navy for RVWAP 1, maroon for RVWAP 2, fuchsia for RVWAP 3).
RVWAP 1–3 Period Length : Set the period for the rolling VWAP (default: 20, 50, 100).
RVWAP 1–3 Source : Select the price source (default: hlc3).
RVWAP 1–3 Offset : Set the horizontal offset (default: 0).
Show RVWAP 1–3 Bands : Toggle upper/lower bands (default: disabled).
RVWAP 1–3 Band Multiplier : Adjust the standard deviation multiplier for bands (default: 1.0).
VWAP Label Settings
Show VWAP % Difference Labels : Enable/disable percentage difference labels for all VWAPs (default: enabled, showing AVWAP 1 label).
VWAP Label Font Size (8–20) : Adjust the font size for VWAP labels (default: 10, mapped to “tiny”).
How It Works
EMAs : Calculated using ta.ema(close, length) for each user-defined period. Percentage differences are computed as ((close - ema) / close) * 100 and displayed as labels for visible EMAs when show_ema_labels is enabled.
Anchored VWAPs : Calculated using ta.vwap(source, anchor, 1), where the anchor is determined by the selected timeframe (Session, Week, or Month). Bands are computed using the standard deviation from ta.vwap.
Rolling VWAPs : Calculated using ta.vwap(source, length), with bands based on ta.stdev(source, length).
Labels : Updated on each new bar (ta.barssince(ta.change(time) != 0) == 0) to show percentage differences. Labels are only displayed for visible EMAs/VWAPs to avoid clutter.
Color Matching: VWAP labels use the same color as their corresponding VWAP lines, set via input settings (e.g., avwap1_color for AVWAP 1).
Example Use Cases
- Trend Following: Use longer EMAs (e.g., 100, 200) to identify trends and shorter EMAs (e.g., 3, 9) for entry/exit signals.
- Mean Reversion: Monitor percentage difference labels to spot overbought/oversold conditions relative to EMAs or VWAPs.
- VWAP Trading: Use the default session-anchored AVWAP 1 for intraday trading, adding weekly/monthly VWAPs or rolling VWAPs for broader context.
- Intraday Analysis: Leverage the session-anchored AVWAP 1 (enabled by default) for day trading, with bands as support/resistance zones.
Emre AOI Zonen Daily & Weekly (mit Alerts, max 60 Pips)This TradingView indicator automatically highlights Areas of Interest (AOI) for Forex or other markets on Daily and Weekly timeframes. It identifies zones based on the high and low of the previous period, but only includes zones with a width of 60 pips or less.
Features:
Daily AOI Zones in blue, Weekly AOI Zones in yellow with 20% opacity, so candlesticks remain visible.
Persistent zones: AOI boxes stay on the chart until the price breaks the zone.
Multiple zones: Supports storing multiple Daily and Weekly AOIs simultaneously.
Break Alerts: Sends alerts whenever a Daily or Weekly AOI is broken, helping traders spot key levels in real-time.
Fully automated: No manual drawing needed; zones are updated and extended automatically.
Use Case:
Ideal for traders using a top-down approach, combining Weekly trend analysis with Daily entry signals. Helps identify support/resistance, supply/demand zones, and critical price levels efficiently.

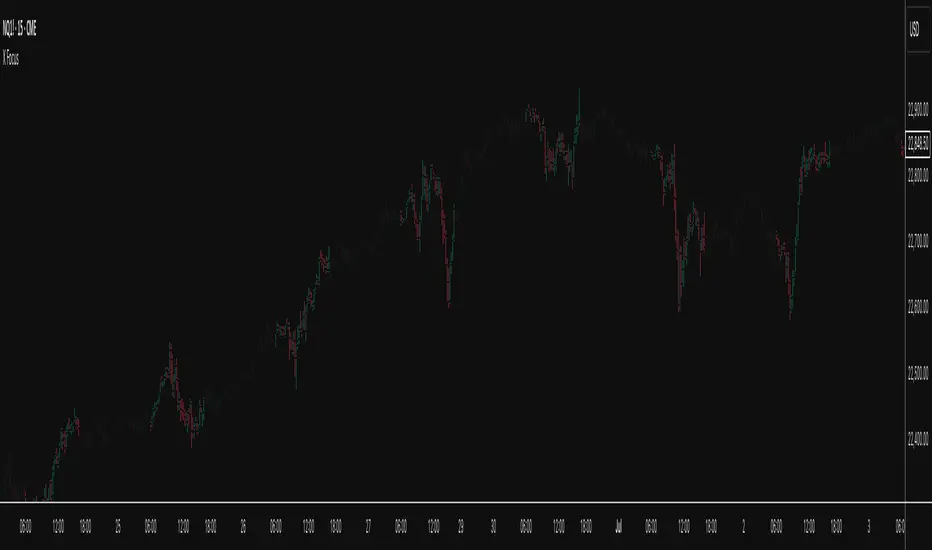
X FocusDesigned to help traders reduce distractions by de-emphasizing specific time ranges on the chart. Instead of highlighting high-activity zones, this tool intentionally applies a muted overlay to selected sessions, allowing traders to concentrate on price action that occurs outside those designated ranges.
Core Purpose
The primary goal of this indicator is to combat the “noise” that often arises during certain periods, such as overnight sessions or pre-market trading. By visually softening those areas, traders can focus on the more relevant trading windows WITHOUT losing any time-based context. Unlike traditional tools that remove data entirely, X Focus preserves all candlestick and price information—ensuring that key levels, gaps, or reference values are still visible.
Key Features
Custom Session Filtering
Users can define up to three time ranges depending on preference. This flexibility allows for tailoring the indicator to different market strategies.
De-Emphasis by Design
Instead of masking or deleting data, the indicator overlays a semi-transparent shading box over the chosen sessions. This ensures traders remain aware of the data while maintaining visual focus on the price action outside of the selected time blocks.
Dual Utility – Highlight or Suppress
While built on the principle of minimizing distractions, the same framework can also be used in reverse to highlight specific areas of interest. This versatility makes it suitable for both noise-reduction and spotlighting critical ranges.
Dark Mode / Light Mode
Adjustable color schemes allow seamless integration into any chart setup, whether the user prefers dark or light backgrounds.
Non-Intrusive Visualization
The shading effect is applied without altering price bars, indicators, or other overlays. This ensures compatibility with existing technical tools and strategies.
Use Case
Traders who find themselves reacting too strongly to inconsequential movements during certain times (such as after-hours or low-volume sessions) can benefit from the X Focus indicator. It helps maintain clarity and discipline by visually guiding attention toward the periods that matter most—without erasing or ignoring potentially useful price references.
Fractals + FVG [Combined]Звісно, ось варіант опису англійською, який можна використати для публікації індикатора в TradingView.
Description
This script combines two powerful and widely-used trading concepts into a single, comprehensive indicator: Bill Williams Fractals with dynamic support/resistance lines and Fair Value Gaps (FVG) based on the popular logic from LuxAlgo.
The goal is to provide a cleaner chart by merging two essential tools, allowing traders to analyze market structure and imbalances simultaneously.
Features
1. Williams Fractals with Invalidation Lines
This part of the indicator identifies classic Bill Williams fractals and enhances them with a unique visualization feature.
Fractal Detection: Automatically identifies both bullish (bottom) and bearish (top) fractals. You can choose between a 3-bar or 5-bar pattern in the settings.
Dynamic S/R Lines: A horizontal line is automatically drawn from every confirmed fractal, acting as a potential support or resistance level.
Automatic Invalidation: A line is considered "invalidated" or breached when the body of a candle closes past it. When this happens, the line stops extending, changes its color to the "invalidated" color, and remains on the chart as a historical reference. This provides a clear, objective signal that a level has been broken.
Customization: You can fully customize the colors for the support, resistance, and invalidated lines to match your chart theme.
2. Fair Value Gaps (FVG) / Imbalance
This module incorporates the robust FVG detection logic from LuxAlgo to automatically identify and display market imbalances.
FVG Detection: Highlights bullish and bearish Fair Value Gaps on the chart with colored boxes, representing inefficiencies in price delivery.
Automatic Mitigation: The FVG boxes are automatically removed from the chart once the price has "mitigated" or filled the gap, keeping your workspace clean and focused on active imbalances.
Multi-Timeframe (MTF): You can set the indicator to find and display FVGs from a higher timeframe directly on your current chart.
Dashboard: An optional on-screen dashboard provides a quick summary of the total count of bullish/bearish FVGs and the percentage that have been mitigated.
Full Customization: Control the colors of FVG boxes, extend their length, and configure other visual style settings.
How to Use
Fractal Lines: Use the active support and resistance lines as key levels for potential bounces or breaks. A line's invalidation can serve as confirmation of a shift in market structure.
FVG Zones: Fair Value Gaps often act as "magnets" for price. Use these zones as potential targets for your trades or as areas of interest for entries when price retraces to fill the imbalance.
Combined Strategy: The true power of this indicator comes from combining both concepts. For example, a bullish FVG forming near a key fractal support level can create a high-probability confluence zone for a long entry. Similarly, a break and invalidation of a fractal resistance line might signal that price is heading towards the next bearish FVG above.
This indicator is a tool for analysis and should be used in conjunction with your own trading strategy and risk management rules.

Value Matrix – Previous Day VAValue Matrix – Previous Day Volume Profile Indicator
Description:
The Value Matrix – Previous Day VA indicator plots the previous trading session’s Volume Profile key levels directly on your chart, providing clear reference points for intraday trading. This indicator calculates the Value Area High (VAH), Value Area Low (VAL), and Point of Control (POC) from the prior session and projects them across the current trading day, helping traders identify potential support, resistance, and high-volume zones.
Features:
Calculates previous day VAH, VAL, and POC based on a user-defined session (default 09:30–16:00).
Uses Volume Profile bins for precise distribution calculation.
Fully customizable line colors for VAH, VAL, and POC.
Lines extend across the current session for easy intraday reference.
Works on any timeframe, optimized for 1-minute charts for precision.
Optional toggles to show/hide VAH, VAL, and POC individually.
Inputs:
Session Time: Define the trading session for which the volume profile is calculated.
Profile Bins: Number of price intervals used to divide the session range.
Value Area %: Percentage of volume to include in the value area (default 70%).
Show POC / VAH & VAL: Toggle visibility of each level.
Line Colors: Customize VAH, VAL, and POC colors.
Use Cases:
Identify previous session support and resistance levels for intraday trading.
Gauge areas of high liquidity and potential market reaction zones.
Combine with other indicators or price action strategies for improved entries and exits.
Recommended Timeframe:
Works on all timeframes; best used on 1-minute or 5-minute charts for precise intraday analysis.

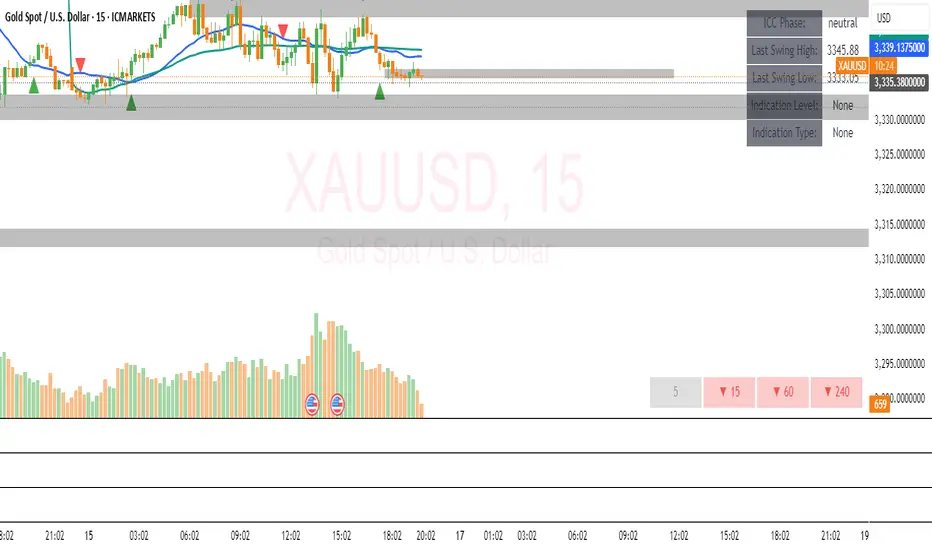
ICC Trading System# ICC Trading System - Indication, Correction, Continuation
## Overview
The ICC (Indication, Correction, Continuation) Trading System is a comprehensive market structure analysis tool designed to identify high-probability trend continuation setups. This indicator helps traders understand market phases and provides clear entry signals based on institutional trading concepts.
## Key Features
### 🎯 **Market Structure Analysis**
- Automatic detection of swing highs and swing lows
- Real-time identification of market trends and reversals
- Dynamic support and resistance zone mapping
- Clear visual representation of market phases
### 📊 **ICC Phase Detection**
- **Indication Phase**: Identifies new higher highs (bullish) or lower lows (bearish)
- **Correction Phase**: Tracks pullbacks and retracements
- **Continuation Phase**: Signals when trends resume after corrections
### 🚀 **Entry Signals**
- Precise BUY signals after bullish indications and corrections
- Clear SELL signals after bearish indications and corrections
- Entry points based on price breaking back through key levels
- Eliminates guesswork in trend continuation trades
### 🎨 **Visual Components**
- Swing point markers (triangles) for easy identification
- Color-coded support/resistance zones
- Background highlighting for current market phase
- Information table showing current
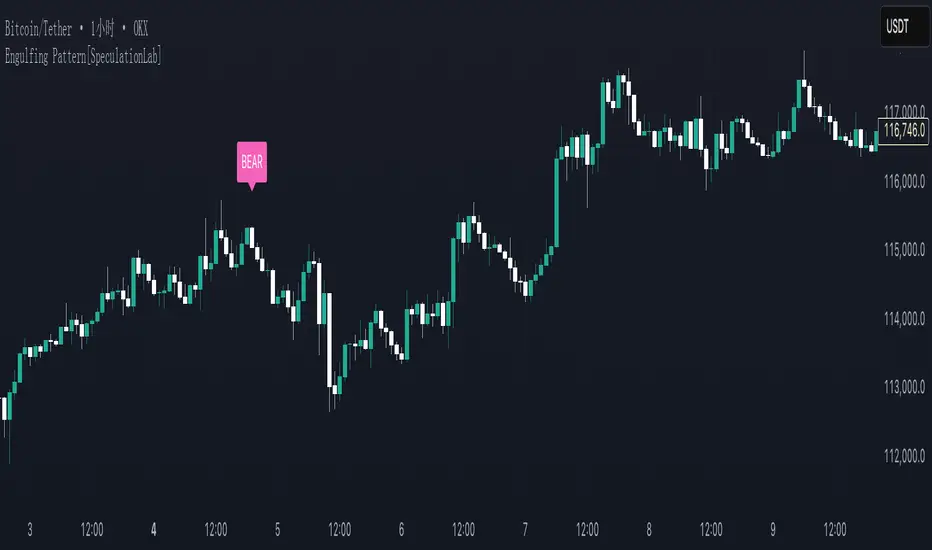
Engulfing Pattern[SpeculationLab]Overview
This script detects two types of engulfing / outer bar patterns and marks them directly on the chart:
Body Engulfing – The current candle’s body range (open–close) completely covers the entire range (high–low) of the previous candle.
Range Engulfing – The current candle’s full range (high–low, including wicks) completely covers the entire range (high–low) of the previous candle.
Direction logic:
Bull – The previous candle is bearish and the selected engulfing rule is met.
Bear – The previous candle is bullish and the selected engulfing rule is met.
Optional: Require the current candle to have the opposite color of the previous one.
This is an open-source pattern recognition tool for learning, backtesting, and chart review. It is not financial advice.
Key Features
Two detection modes:
body – Body engulfs previous entire range
range – Wicks engulf previous entire range
Direction detection based on the previous candle’s color, with optional opposite-color confirmation
Chart markers: “BULL” /“BEAR” above bars
Alert-ready: built-in conditions for bullish and bearish engulfing patterns
Parameters
Engulfing Type: body / range
body: Current body must fully cover the previous candle’s high–low range
range: Current full range (high–low) must fully cover the previous candle’s high–low range
Require Opposite Previous Candle (default: off):
When enabled, the engulfing pattern must also have the opposite color from the previous candle to trigger
Usage Tips
Engulfing patterns are price action structures; combine with trend, key levels, and volume for context
Signals confirm on bar close (barstate.isconfirmed) to reduce repainting
Can be used with personal risk management rules (stop-loss, take-profit, filters)
Disclaimer
For educational and research purposes only – not financial advice
Past performance of patterns does not guarantee future results
Trading involves risk; always manage it responsibly
This script is open-source – feel free to learn from or modify it, but credit the original source and author (SpeculationLab)
脚本简介
本脚本用于识别两类包裹/外包形态,并在图表上以标记提示:
Body(实体包裹):当前K线的实体区间(开—收)完全覆盖上一根K线的整个区间(上一根的高—低)。
Range(影线外包):当前K线的影线区间(高—低)完全覆盖上一根K线的整个区间(上一根的高—低)。
方向判定:
Bull(多):上一根为阴线且满足所选包裹规则;
Bear(空):上一根为阳线且满足所选包裹规则;
可选项:要求“当前K线颜色与上一根相反”后再确认(见参数)。
本脚本为开源形态识别工具,适合技术分析学习、回测与复盘,不构成任何投资建议。
主要功能
两种识别模式:body(实体包裹上一根整段) / range(影线包裹上一根整段)。
方向识别:按上一根K线颜色判断多空;可选“当前颜色与上一根相反”的二次确认。
图表提示:plotshape 在K线上方标注 “BULL / BEAR”。
提醒支持:内置 Bullish Engulf / Bearish Engulf 提醒条件。
参数说明
Engulfing Type:body / range
body:当前实体须完全覆盖上一根的高—低整段;
range:当前高—低须完全覆盖上一根的高—低整段。
Require Opposite Previous Candle(默认关闭):
开启后,除满足包裹规则外,还需当前K线颜色与上一根相反才触发标记。
使用建议
包裹/外包是价格行为结构,建议结合趋势、关键价位、成交量等因素综合判断。
信号在收盘时确认(barstate.isconfirmed),以减少重绘干扰。
可与个人风格的风险控制规则(止损、止盈、过滤条件)配合使用。
合规与免责声明
本脚本仅用于技术研究与学习,不构成任何形式的投资建议或收益承诺。
历史形态并不代表未来结果,交易有风险,请自行评估并承担责任。
本脚本开源,欢迎学习与二次开发;转载或改用请注明来源与作者(SpeculationLab / 投机实验室)。
Forex Session Levels + Dashboard (AEST)This is a script showing all the key levels you will ever need for the breakout and retest strategy.
Follow my IG:
@liviupircalabu10

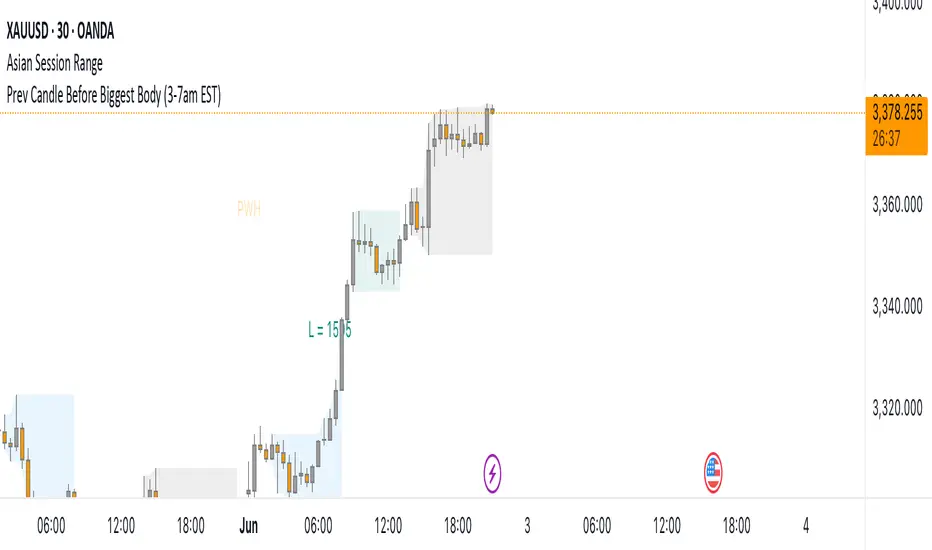
Prev Candle Before Biggest Body (3-7am EST)This indicator automatically identifies and marks, for each trading day, the candle immediately preceding the largest open-to-close movement (in pips) during the key London session window from 3:00am to 7:00am EST (New York time). The largest candle is determined by the absolute difference between its open and close prices, measured in pips. The candle just before this “biggest” move is highlighted with a distinctive pink flag above the bar. This tool is especially useful for traders seeking to analyze pre-breakout price action or to identify key levels and setups that occur right before significant volatility during the early London session.
RTH Session Range Position (0-100) with EMAA Pine Script indicator designed to help traders understand where the current price is located within the Regular Trading Hours (RTH) session range, from 0 (session low) to 100 (session high). It also plots a smoothed EMA of this position to provide insight into momentum or trend during the RTH session.
What the Indicator Does
Defines RTH (Regular Trading Hours):
Start: 9:30 AM
End: 4:00 PM
These are typical US equity market hours.
Tracks the session's high and low during RTH:
sessionHigh and sessionLow update only during RTH.
Calculates position of the current price within the RTH range:
Formula: ((close - sessionLow) / (sessionHigh - sessionLow)) * 100
Result is a percentage:
0 = at session low
100 = at session high
50 = middle of session range
Calculates an EMA of that position (posEMA):
Smooths out the raw position to help visualize momentum within the range.
Plots and table:
Plots pos and posEMA on a separate chart pane.
Adds horizontal lines at key levels (0, 30, 50, 70, 100).
Table shows current values for Position, EMA, and Range.
Visual cues:
bgcolor highlights when pos crosses over or under the EMA — potential momentum shifts.
Alerts:
Cross above/below 50 (session midpoint).
Cross above/below EMA.
How to Use It Effectively
1. Session Strength & Momentum
Position above 70: Price is near session highs — strong upward momentum.
Position below 30: Price is near session lows — strong downward momentum.
Use the EMA of position to filter out noise and identify trends.
2. Breakout or Reversal Detection
Cross above EMA: Momentum may be turning bullish.
Cross below EMA: Momentum may be turning bearish.
These crosses (especially near mid-levels like 50) can hint at session trend shifts.
3. Range Context for Entries
If you're a mean-reversion trader, look for:
Price > 70 + turning down below EMA → possible short.
Price < 30 + turning up above EMA → possible long.
For breakout traders, you might wait for:
Crosses above 70 with EMA support.
Crosses below 30 with EMA resistance.
4. Confirmation Tool
Use this indicator alongside others to confirm:
Whether price action has strength within the day.
Whether breakouts have real momentum or are extended already.

AP IFTCCIv2/IFTStoch/IFTRSI Multi-TimeframeMulti-Timeframe IFT-CCI/Stoch/RSI Composite
This enhanced indicator combines three powerful oscillators—Inverse Fisher Transform (IFT) versions of the Commodity Channel Index (CCI), Stochastic, and Relative Strength Index (RSI)—into a unified multi-timeframe analysis tool. Originally developed by John Ehlers (pioneer of cyclical analysis and signal processing in trading systems) and adapted by KIVANC (@fr3762), this version adds dual-timeframe capability to compare indicator values across different chart resolutions.
Key Features:
Triple Oscillator Composite
IFT-CCI: Smoothed CCI values transformed via Ehlers' Inverse Fisher Transform (blue-gold)
IFT-Stochastic: Classic stochastic oscillator processed through IFT (blue)
IFT-RSI: RSI oscillator converted to IFT format (magenta)
Composite Average Line: Combined average of all three indicators (green)
Multi-Timeframe Analysis
Compare primary and secondary timeframes (e.g., 1H vs. 4H, daily vs. weekly)
Primary timeframe plots use solid lines with 80% opacity
Secondary timeframe (optional) uses dashed/circle markers with 40% opacity
Key Levels
Overbought (+0.75) and oversold (-0.75) reference lines
Zero-centerline for momentum direction bias
Applications:
Trend Confirmation: Align higher timeframe signals with lower timeframe entries
Divergence Detection: Spot inter-timeframe discrepancies in momentum
Regime Filter: Use higher timeframe composite values to filter trades
Technical Basis:
Inverse Fisher Transform: Compresses oscillator values into bounded (-1 to +1) range while emphasizing extreme moves
Dual WMA Smoothing: Combines initial calculation smoothing (WMA1) with final output smoothing (WMA2)
Exponential Scaling: (e^2x - 1)/(e^2x + 1) formula converts Gaussian-like distributions to bounded outputs
Credits:
Original Concept: John Ehlers (IFT methodology, cyclical analysis foundations)
Initial Implementation: KIVANC (@fr3762 on Twitter) for the base IFT-CCI/Stoch/RSI script
Multi-Timeframe Adaptation: for cross-resolution analysis capabilities
This tool is particularly effective for traders seeking to align multiple timeframes while using Ehlers' noise-reduction techniques. The composite average line provides a consensus view, while the individual oscillators help identify component strength/weakness.

ICT Macro and Daye QT ShiftEST Vertical Lines - Auto DST Adjustment
Overview
This indicator draws customizable vertical lines at specific Eastern Time (EST/EDT) points throughout the trading day, automatically adjusting for daylight savings time. Designed for precision trading on 1-minute and 5-minute charts, it highlights key intraday moments when price action tends to accelerate.
Features
- **18 pre-configured NY session times** (09:50-15:45 ET)
- **Auto timezone conversion** - Always shows correct EST/EDT regardless of your local timezone
- **3 line styles** - Choose between solid/dashed/dotted lines
- **Clean labeling** - Optional time markers above each line
- **1m/5m optimized** - Perfect for scalpers and day traders
- **Visual alerts** - "TOUCH" labels when price interacts with lines
Inputs
| Parameter | Description | Default |
|-----------|-------------|---------|
| Line Times | Comma-separated HH:MM times | 09:50,10:10,...15:45 |
| Line Color | Line color | Black |
| Line Width | 1-5px thickness | 2 |
| Line Style | Solid/Dashed/Dotted | Solid |
| Show Labels | Display time markers | true |
How To Use
1. Apply to 1m or 5m charts
2. Lines appear automatically at specified EST times
3. Watch for price reactions at these key levels
4. Customize styles via indicator settings
Ideal For
- NY open/London close traders
- Earnings/News traders
- Breakout traders
- Market open/close strategies
Updates
v1.1 - Added line style customization
v1.0 - Initial release

SMC Entry Signals MTF v2📘 User Guide for the SMC Entry Signals MTF v2 Indicator
🎯 Purpose of the Indicator
This indicator is designed to identify reversal entry points based on Smart Money Concepts (SMC) and candlestick confirmation. It’s especially useful for traders who use:
Imbalance zones, order blocks, breaker blocks
Liquidity grabs
Multi-timeframe confirmation (MTF)
📈 How to Use the Signals on the Chart
✅ LONG Signal (green triangle below the candle):
Conditions:
Price is in a discount zone (below the FIB 50% level)
A bullish engulfing candle appears
A bullish Order Block (OB) or Breaker Block is detected
There’s an upward imbalance
A bullish OB is confirmed on the higher timeframe
➡️ How to act:
Consider entering long on the current or next candle.
Place your stop-loss below the OB or the nearest swing low.
Take profit at the nearest liquidity zone or premium area (above FIB 50%).
🔻 SHORT Signal (red triangle above the candle):
Conditions:
Price is in a premium zone (above FIB 50%)
A bearish engulfing candle appears
A bearish OB or Breaker Block is detected
There’s a downward imbalance
A bearish OB is confirmed on the higher timeframe
➡️ How to act:
Consider short entry after the signal.
Place your stop-loss above the OB or swing high.
Target the discount zone or the next liquidity pocket.
⚙️ Recommended Settings by Trading Style
Trading Style Suggested Settings Notes
Intraday (1–15m) fibLookback = 20–50, obLookback = 5–10, htf_tf = 1H/4H Fast signals. Use Discount/Premium + Engulfing.
Swing/Position (1H–1D) fibLookback = 50–100, obLookback = 10–20, htf_tf = 1D/1W Higher trust in MTF confirmation. Ideal with fundamentals.
Scalping (1m) fibLookback = 10–20, obLookback = 3–5, htf_tf = 15m/1H Remove Breaker and MTF for quick reaction trades.
🧠 Best Practices for Traders
Trend Filtering:
Use EMAs or volume to confirm the current trend.
Take longs only in uptrends, shorts in downtrends.
Liquidity Zones:
Use this indicator after liquidity grabs.
OBs and Breakers often appear right after stop hunts.
Combine with Manual Zones:
This works best when paired with manually drawn OBs and key levels.
Backtest the Signals:
Use Bar Replay mode on TradingView to test past signals.
🧪 Example Trade Setup
Example on BTCUSDT 15m:
Price drops into the discount zone.
A green triangle appears (bullish engulfing + OB + imbalance + HTF OB).
You enter long, stop below the OB, target the premium zone.
🎯 This type of setup often gives a risk/reward ratio of 1:2 or better — profitable even with a 40% win rate.
⏰ Alerts & Automation
Enable alerts:
"SMC Long Entry" — fires when a long signal appears.
"SMC Short Entry" — fires when a short signal appears.
You can integrate this with bots via webhook, like:
TradingConnector, 3Commas, Alertatron, etc.
✅ What This Indicator Gives You
High-probability entries using SMC logic
Customizable filters for entry logic
Multi-timeframe confirmation for stronger setups
Suitable for both intraday and swing trading

Smart Market Matrix Smart Market Matrix
This indicator is designed for intraday, scalping, providing automated detection of price pivots, liquidity traps, and breakout confirmations, along with a context dashboard featuring volatility, trend, and volume.
## Summary Description
### Menu Settings & Their Roles
- **Swing Pivot Strength**: Controls the sensitivity for detecting High/Low pivots.
- **Show Pivot Points**: Toggles the display of HH/LL markers on the chart.
- **VWMA Length for Trap Volume** & **Volume Spike Multiplier**: Identify concentrated volume spikes for liquidity traps.
- **Wick Ratio Threshold** & **Max Body Size Ratio**: Detect candles with disproportionate wicks and small bodies (doji-ish) for traps.
- **ATR Length for Trap**: Measures volatility specific to trap detection.
- **VWMA Length for Breakout Volume**, **ATR Multiplier for Breakout**, **ATR Length for Breakout**, **Min Body/Range Ratio**: Set adaptive breakout thresholds based on volatility and volume.
- **OBV Smooth Length**: Smooths OBV momentum for breakout confirmation.
- **Enable VWAP Filter for Confirmations**: Optionally validate breakouts against the VWAP.
- **Enable Higher-TF Trend Filter** & **Trend Filter Timeframe**: Align breakout signals with the 1h/4h/Daily trend.
- **ADX Length**, **EMA Fast/Slow Length for Context**: Parameters for the context dashboard (Volatility, Trend, Volume).
- **Show Intraday VWAP Line**, **VWAP Line Color/Width**: Display the intraday VWAP line with custom style.
### Signal Interpretation Map
| Signal | Description | Recommended Action |
|--------------------------------|-----------------------------------------------------------|-------------------------------------------|
| 📌 **HH / LL (pivot)** | Market structure (support/resistance) | Note key levels |
| **Bull Trap(green diamond)** | Sweep down + volume spike + wick + rejection | Go long with trend filter
| **Bear Trap(red diamond)** | Sweep up + volume spike + wick + rejection | Go short with trend filter
| 🔵⬆️ **Breakout Confirmed Up** | Close > ATR‑scaled high + volume + OBV↑ | Go long with trend filter |
| 🔵⬇️ **Breakout Confirmed Down** | Close < ATR‑scaled low + volume + OBV↓ | Go short with trend filter |
| 📊 **VWAP Line** | Intraday reference to guide price | Use as dynamic support/resistance |
| ⚡ **Volatility** | ATR ratio High/Med/Low | Adjust position size |
| 📈 **Trend Context** | ADX+EMA Strong/Moderate/Weak | Confirm trend direction |
| 🔍 **Volume Context** | Breakout / Rising / Falling / Calm | Check volume momentum |
*This summary gives you a quick overview of the key settings and how to interpret signals for efficient intraday scalping.*
### Suggested Settings
- **Intraday Scalping (5m–15m)**
- `Swing Pivot Strength = 5`
- `VWMA Length for Trap Volume = 10`, `Volume Spike Multiplier = 1.6`
- `ATR Length for Trap = 7`
- `VWMA Length for Breakout Volume = 12`, `ATR Length for Breakout = 9`, `ATR Multiplier for Breakout = 0.5`
- `Min Body/Range Ratio for Breakout = 0.5`, `OBV Smooth Length = 7`
- `Enable Higher-TF Trend Filter = true` (TF = 60)
- `Show Intraday VWAP Line = true` (Color = orange, Width = 2)
- **Swing Trading (4h–Daily)**
- `Swing Pivot Strength = 10`
- `VWMA Length for Trap Volume = 20`, `Volume Spike Multiplier = 2.0`
- `ATR Length for Trap = 14`
- `VWMA Length for Breakout Volume = 30`, `ATR Length for Breakout = 14`, `ATR Multiplier for Breakout = 0.8`
- `Min Body/Range Ratio for Breakout = 0.7`, `OBV Smooth Length = 14`
- `Enable Higher-TF Trend Filter = true` (TF = D)
- `Show Intraday VWAP Line = false`
*Adjust these values based on the symbol and market volatility for optimal performance.*

Volumatic Trend [ChartPrime]
A unique trend-following indicator that blends trend logic with volume visualization, offering a dynamic view of market momentum and activity. It automatically detects trend shifts and paints volume histograms at key levels, allowing traders to easily spot strength or weakness within trends.
⯁ KEY FEATURES
Trend Detection System:
Uses a custom combination of weighted EMA (swma) and regular EMA to detect trend direction.
A diamond appears on trend shift, indicating the starting point of a new bullish or bearish phase.
Volume Histogram Zones:
At each new trend, the indicator draws two horizontal zones (top and bottom) and visualizes volume activity within that trend using dynamic histogram candles.
Gradient-Based Candle Coloring:
Candle color is blended with a gradient based on volume intensity. This helps highlight where volume spikes occurred, making it easy to identify pressure points.
Volume Summary Labels:
A label at the end of each trend zone displays two critical values:
- Delta: net volume difference between bullish and bearish bars.
- Total: overall volume accumulated during the trend.
⯁ HOW TO USE
Monitor diamond markers to identify when a new trend begins.
Use volume histogram spikes to assess if the trend is supported by strong volume or lacking participation.
A high delta with strong total volume in a trend indicates institutional support.
Compare gradient strength of candles—brighter areas represent higher-volume trading activity.
Can be used alone or combined with other confirmation tools like structure breaks, liquidity sweeps, or order blocks.
⯁ CONCLUSION
Volumatic Trend gives you more than just trend direction—it provides insight into the force behind it. With volume-graded candles and real-time histogram overlays, traders can instantly assess whether a trend is backed by conviction or fading strength. A perfect tool for swing traders and intraday strategists looking to add volume context to their directional setups.

SUPeR TReND 2.718An evolved version of the classic Supertrend, SUPeR TReND 2.718 is built to deliver elegant, high-precision trend detection using Euler's constant (e = 2.718) as its default multiplier. Designed for clarity and visual flow, this indicator brings together smooth line work, intelligent color logic, and a minimalistic tally system that tracks trend persistence — all in a highly customizable, overlay-ready format.
Unlike traditional implementations, this version maintains line visibility regardless of fill opacity, ensuring crisp tracking even in complex environments. Ideal for traders who value both aesthetics and actionable structure.
__________________________________________________________
🔑 Key Features:
- 📐 ATR-based Supertrend with default multiplier = e (2.718)
- 📉 Dynamic trend line with optional fill beneath price
- ⏳ Trend duration tally label (count-only or full format)
- ⬆️ Higher-timeframe Supertrend overlay (optional)
- 🟢 Directional candle coloring for clarity
- 🟡 Subtle anchor line to guide perception without clutter
- ⚙️ PineScript v6 compliant, efficient and modular
__________________________________________________________
🧠 Interpretation Guide:
- The Supertrend line tracks trend support or resistance — beneath price in uptrends, above in downtrends.
- The shaded fill reflects direction with 70% transparency.
- The trend tally label counts how long the current trend has lasted.
- Candle colors confirm direction without overtaking price action.
- The optional HTF line shows higher-timeframe context.
- A soft yellow anchor line stabilizes the fill relationship without distraction.
__________________________________________________________
⚙️ Inputs & Controls:
- ✏️ ATR Length – Volatility lookback
- 🧮 Multiplier – Default = 2.718 (Euler's number)
- 🕰️ Higher Timeframe – Choose your bias frame
- 👁️ Show HTF / Main – Toggle each trend layer
- 🧾 Show Label / Simplify – Show trend duration, with or without arrows
- 🎨 Color Candles – Turn directional bar coloring on or off
- 🪄 Show Fill – Toggle the shaded visual rhythm
- 🎛️ All visuals use tuned colors and transparencies for clarity
__________________________________________________________
🚀 Best Practices:
- ✅ Works on any time frame; shines on 1h v. 1D
- 🔁 Use the HTF line for macro bias filtering
- 📊 Combine with volume or liquidity overlays for edge
- 🧱 Use as a structural base layer with minimalist stacks
__________________________________________________________
📈 Strategy Tips:
- 🧭 MTF Trend Alignment: Enable the HTF line to filter trades. If the HTF trend is up, only take longs on the lower frame, and vice versa.
- 🔁 Pullback Entries: During a strong trend, consider short-term dips below the Supertrend line as possible re-entry zones — only if HTF remains aligned.
- ⏳ Tally for Exhaustion: When the bar count exceeds 15+, look for confluence (volume divergence, key levels, reversal signals).
- ⚠️ HTF Flip + Extended Trend: When the HTF trend reverses while the main trend is extended, that may be a macro exit or fade signal.
- 🚫 Solo Mode: Disable HTF and use the main trend + tally as a standalone signal layer.
- 🧠 Swing Setup Friendly: Especially powerful on 1D or 1h in swing systems or trend-based grid strategies.
Oracle Prediction Futur
// (\_/)
// ( •.•)
// (")_(")
Indicator Description: Oracle Prediction Futur
The Oracle Prediction Futur is a sophisticated technical indicator designed for traders and analysts looking to gain insights into market trends through the analysis of price movements. This Pine Script™ code integrates innovative elements to enhance the trading experience and is governed by the Mozilla Public License 2.0.
Key Features:
Normalization of Closing Prices:
The indicator normalizes closing prices over a defined lookback period (100 periods) to provide a percentage-based representation of the current price relative to its historical range. This helps in identifying potential price extremes.
Peak and Trough Detection:
It identifies and plots peak tops and bottom troughs based on normalized closing values. Peak tops are marked with vibrant magenta circles, while peak bottoms are indicated by soothing cyan circles, helping traders visually spot significant turning points in the price action.
Dynamic Background Gradient:
The indicator features a visually appealing gradient background that represents market sentiment. The background color transitions between bear and bull colors based on the position of the normalized close within the 0-100 range. This provides an immediate visual cue about the strength or weakness of the market.
Horizontal Reference Lines:
The indicator includes horizontal lines at key levels (9.51 and 92.5) for quick reference, which can help to gauge areas of potential support or resistance.
User-Friendly Visuals:
The combination of background colors, dynamic plots, and clear labeling offers a user-friendly visual representation, making it easier to interpret market conditions at a glance.
Overlay Options:
As an overlay-free indicator, it maintains clarity on the price chart while providing insightful trends and forecasts.
Practical Application:
Traders can utilize the Oracle Prediction Futur indicator to identify potential entry and exit points in their trading strategies. By observing the peaks, troughs, and background color shifts, users can better understand market momentum and price action.
How to Use:
Deploy this indicator on your trading platform, and analyze the peaks and troughs along with the normalized close line and background gradient to inform your trading decisions. Look for alignment between price action and the signaling provided by the indicator for optimized trading results.
